Over the past few weeks, we have seen an incredibly volatile stock market that has rattled investors and consumers alike. With major indices (Dow Jones, S&P, and NASDAQ) shedding ~30% of their value in 3 weeks, there is a rightful concern for most businesses and nonprofits to believe that consumer spending will become strained and we will likely enter into a recession quickly.
At Windfall, we are on a mission to determine the net worth of every person on the planet. Today, we are focused on the US, and the recent development has our team and customers wondering:
How much does the stock market impact wealth?
This is a really hard question, and of course, it does not have a simple answer that satisfies every household in the US. In fact, we also wrote about IPOs and how they do not generate as much wealth as most people think around this same time last year. As this is a fairly complex topic, it requires significant analysis and understanding of US consumers.
Windfall refreshes its data every week to capture changes in wealth. To help understand the impact of the stock market on wealth, we wanted to review the following:
- Understanding Wealth By Asset Classes
- Analyzing the Impact by Different Wealth Levels
- The Impact Beyond Daily Stock Market Fluctuations
- Key Takeaways as the Future Unfolds
Understanding Wealth by Asset Classes
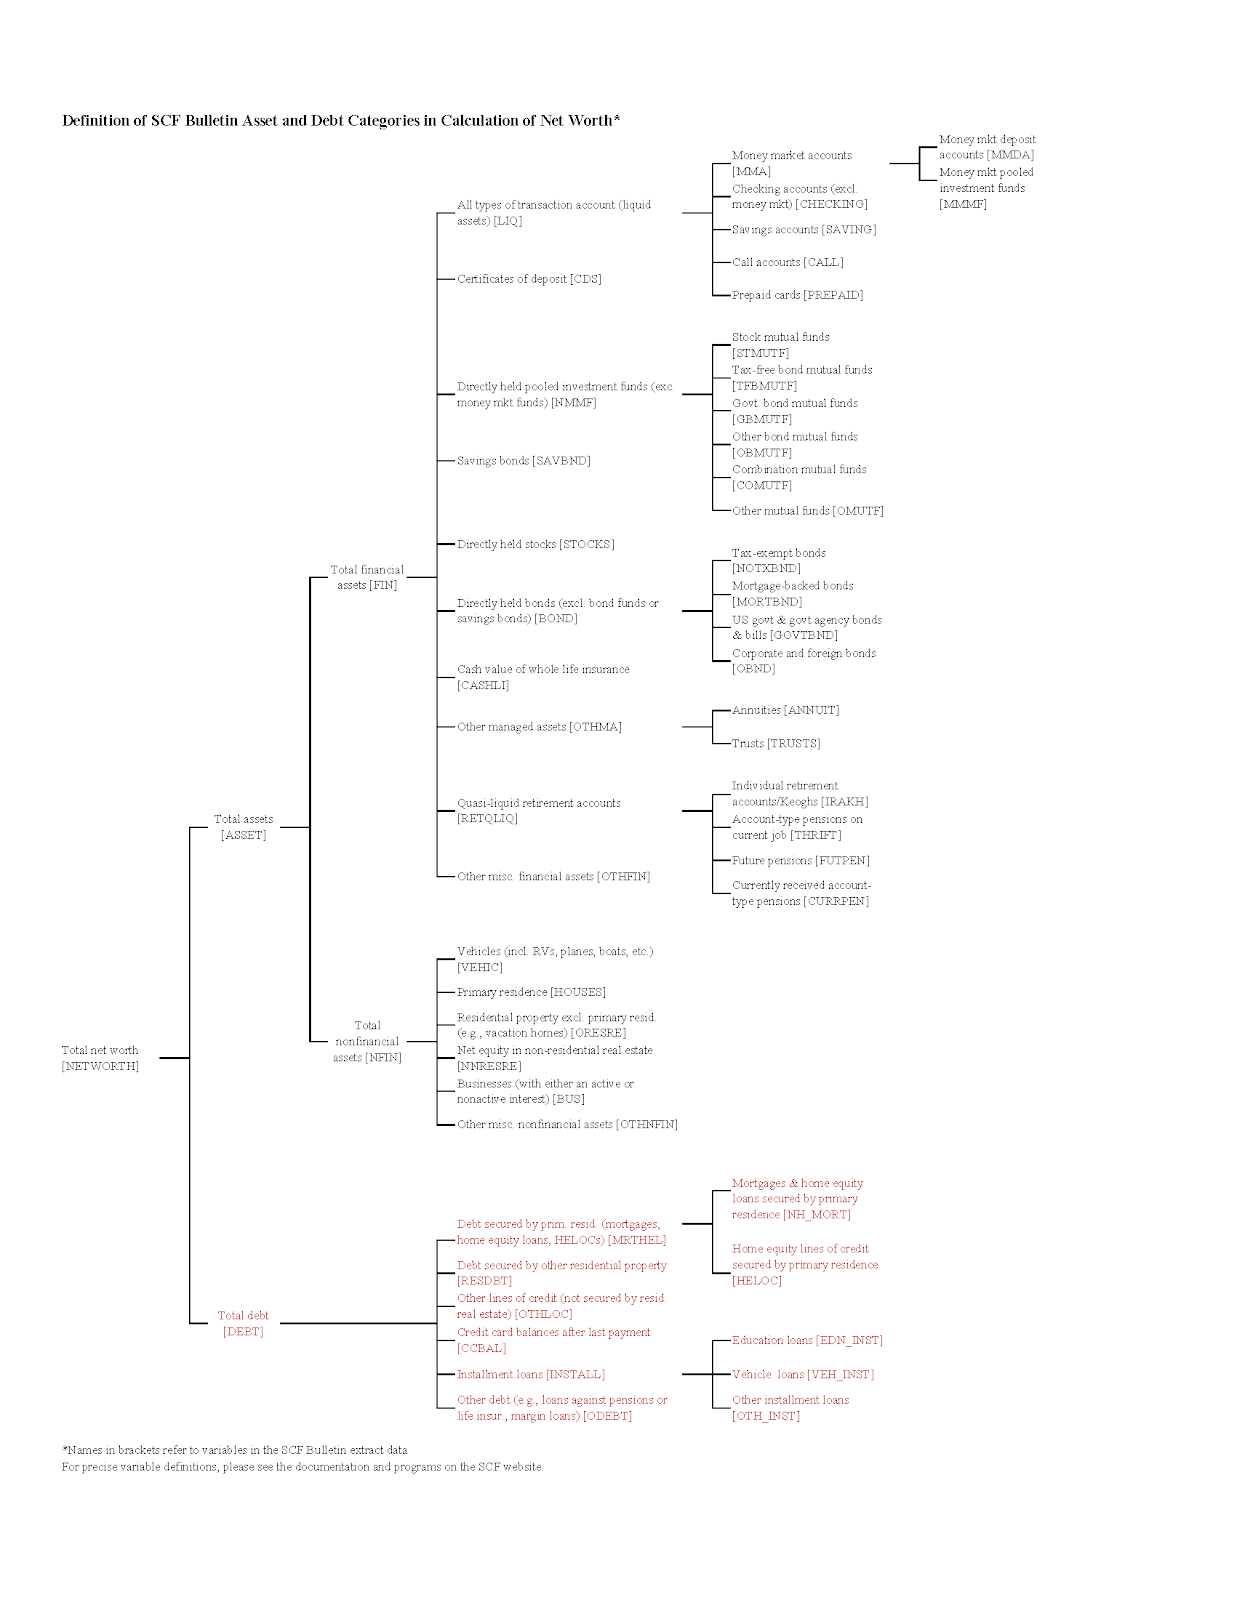
The Federal Reserve conducts a Survey of Consumer Finances (SCF) that captures results of ~6,500 randomly selected households across the country. The goal is to include information on families’ balance sheets, pensions, income, and demographic characteristics. Their breakdown of assets and liabilities helps break down the various asset classes that may be impacted by the stock market.
As we can see from the Assets category (depicted in black), there are four categories that are affected by the open market: directly held stocks (STOCKS), directly held bonds (BOND), retirement accounts (RETQLIQ), and mutual funds (NMMF).
To make sure we can articulate the definition of net worth, we put together a quick illustrative example of a household that has assets and liabilities:

To calculate net worth, we would add up the assets and subtract the liabilities:

In the scenario above, we actually can isolate the 401(k) and see that $50,000 in today’s climate would be considerable to the individual’s net worth. If we removed that 100% of the 401(k) asset, it would reduce their net worth by 80%. Even reducing it by 30%, which is approximately where we are at today, reduces the asset by $15,000 and impacts the individuals net worth by 25%.
Certainly, understanding the impact on this person’s wealth would help provide insights into their consumption behavior. Losing 25%-80% of their net worth could impact the individual’s ability to: spend more on retail items, donate to nonprofit causes, or invest more broadly.
But does this affect all households the same way? According to some recent articles in the past few years, the top 10% of households own 84% of stocks. This includes pension plans, 401(k)’s and individual retirement accounts. These statistics can vary and, for example, other surveys suggest that 53% of households are not investing in the stock market.
Analyzing the Impact by Different Wealth Levels
The example used in the prior section was fairly extreme since the total asset allocation for the 401(k) was close to ~20%. Also note, we ignored age in our analysis, since most people won’t tap into their 401(k) until retirement. Circling back to our original question: we wanted to understand how the stock market impacts consumer wealth. Clearly, if the top 10% of households own the majority of stocks, the answer depends on the wealth level.
At Windfall, we analyzed the public data from the SCF, which was last updated in 2016. We bucketed households together into specific groups and tried to determine the makeup of a household’s asset mix based on the four categories we highlighted earlier: stocks, bonds, mutual funds, and retirement accounts:
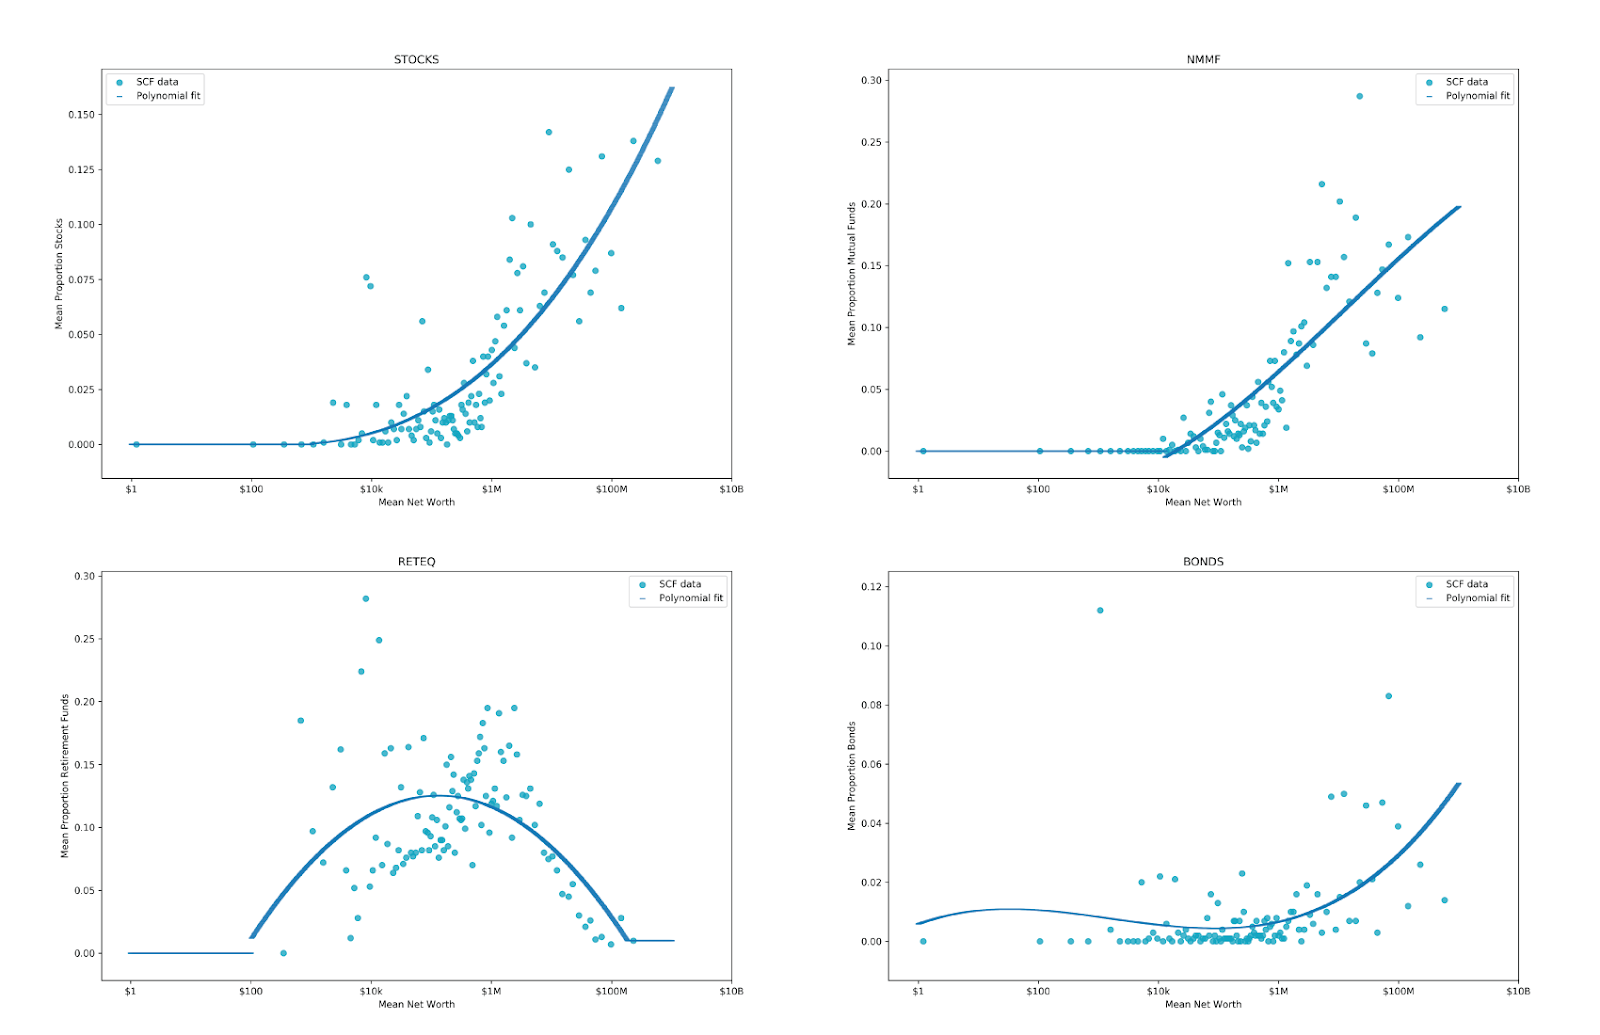
Source: Windfall and Survey of Consumer Financials 2016.
We used a log scale here to show the various households in a relatively scaled manner, so please note that the graph ranges from $0 to $10 billion. For simplicity, we left out negative net worth households from this analysis. In order to show the overall trend, we used various polynomial functions to fit the graph (the dark blue line).
Just by analyzing the four graphs above, we can already see some interesting trends:
- Stocks make up a smaller percentage of net worth in the lower wealth levels and, overall, stocks make up less than 15% of a households asset portfolio
- Mutual funds follow a similar trend, although the ramp is more muted than direct stock investments, but may hold an equal proportion as an asset class
- Retirement accounts generally make up significant wealth for individuals under $1MM but as you grow in wealth, the overall percentage from this asset dramatically diminishes (due to government limits)
- Bonds are a fairly low part of most household’s overall portfolio, though as households get wealthier they are more likely to seek diversification through this asset class
One important caveat you must remember is that while the Dow Jones, S&P 500 and NASDAQ provide a good representation of the broader stock market, the “Stocks” definition in the SCF is directly owned stocks. Thus, there may be scenarios where we see certain stocks outperform the market. For example, let’s take a look at the Dow Jones Index versus Zoom (NASDAQ:ZM), which is a popular video conferencing software system that has gained substantial momentum recently with more and more people are working from home:
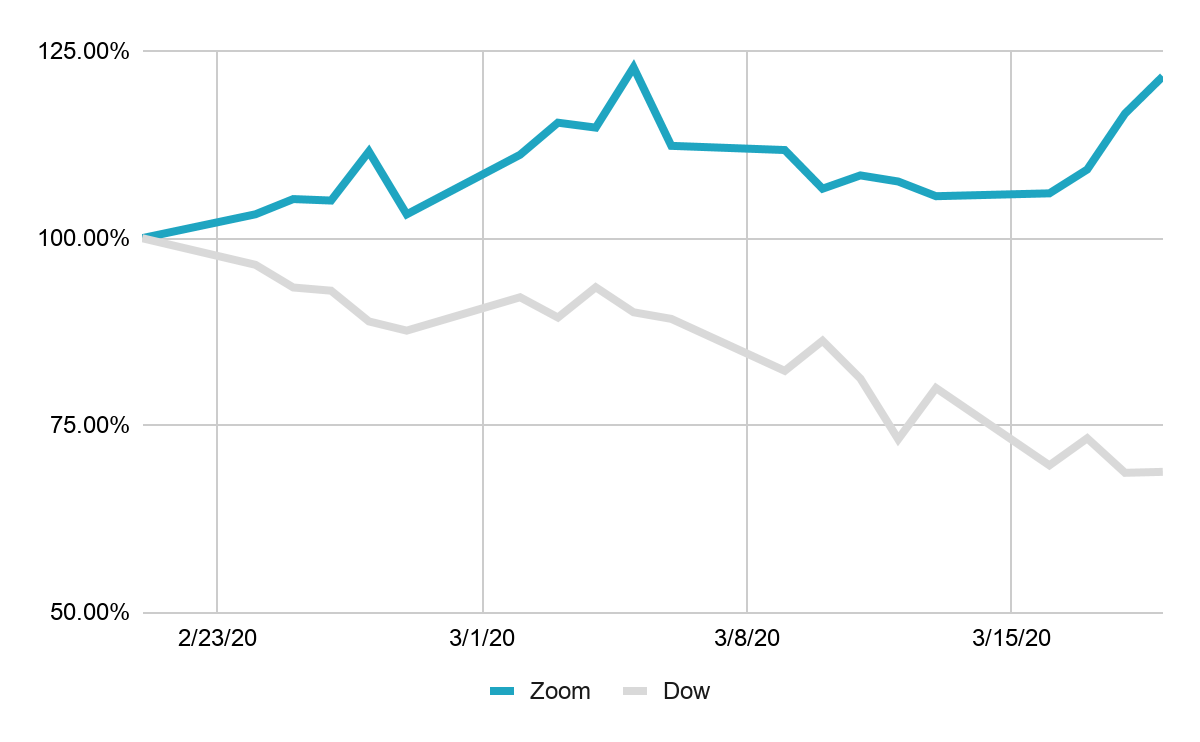
Source: Google Finance as of March 19, 2020.
While most of the stock market is suffering, Zoom has actually increased in value by ~21% while the Dow has decreased by ~30%! If we focus on the population with the most stock in the market, high net worth households above $1 million in wealth, we can illustrate how this may impact the household’s net worth:

Here, we can clearly see that the stock market is not significantly affecting net worth. All of these households still retain significant wealth and purchasing power.
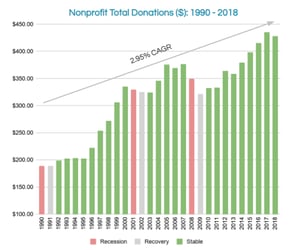
So how can you use this data in practice? As an example, in the nonprofit market, while most vendors focus on gift capacity, this may not necessarily be a good metric to rely on for 2020 goals. Philanthropic giving will most likely retreat and may match the 6% drop in 2008. Using wealth may be a better metric for development professionals and major gift officers to focus on for the remainder of the year to meet 2020 goals. Windfall actually wrote a whitepaper on the differences between gift capacity and precise net worth data.
The Impact Beyond Daily Stock Market Fluctuations
With all the recent media surrounding the stock market, we found it important to dispel the fact that wealth does not go down OR up at the same amount as the stock market. There are also many households that do not invest in the stock market and hold cash, gold, real estate, invest in technology companies, etc. The analysis we conducted also assumed everything else remains constant while the stock market moves.
Does this mean there is nothing to worry about?
No, the stock market is certainly a leading indicator, meaning it has the potential to forecast where the economy is headed. That is why we have seen both monetary and fiscal policies in recent days, including: quantitative easing, federal stimulus money, and other strategies to keep markets from dovetailing.
The lack of this critical action potentially could create issues that would jeopardize the overall financial market with credit markets drying up, mortgage defaults, unemployment rising, and more. Thus, while the stock market doesn’t necessarily correlate to wealth today, the downstream effects could be felt over the next 3, 6, or 12 months (or potentially longer).
At Windfall, we analyze many of these factors including real estate valuations, default rates, small business valuations, and more. The impact of these factors contribute to an overall household’s wealth and makes determining net worth an incredibly complex and challenging problem. Every week, the world changes, and we aim to keep up with all the inputs to provide the most accurate representation in our dataset.
To see how wealth is impacted through other assets at various buckets, we broke down wealth by other SCF categories below:
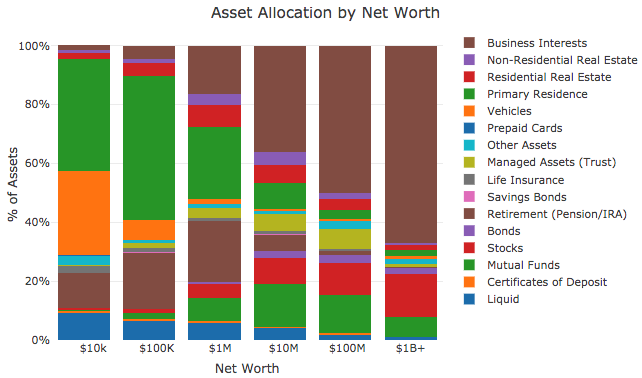
Source: Windfall, Ben Weber, and Survey of Consumer Financials.
Key Takeaways as the Future Unfolds
At the beginning of this post, we posited: How much does the stock market impact wealth?People look to the stock market first, since stock prices are based in part on what investors expect the companies to earn (assuming that the forecasts are fairly accurate). By analyzing the underlying data and what makes up consumer wealth, we saw the impact (especially to the affluent) is much more muted than the overall stock market fluctuation — this is supported through publicly available datasets like the Survey of Consumer Finances.
Wealth is a metric that is becoming more important for organizations to understand. It helps them spend time on the right prospects and needs to be regularly monitored. It’s not good enough to get this data once a year or even once a month anymore as the fluidity of this data is pretty dramatic and data recency will help empower our understanding for day-to-day decisions.
Windfall will continue to monitor these trends and publish our findings through our Medium blog. If you have any questions about Windfall or would like to learn more about products and services, please contact our team, we’d love to hear from you.
The analysis and article was co-authored by Arup Banerjee, CEO, and Jaya Pokuri, Data Scientist, using a combination of third-party research, internal metrics, and surveys.


