Part 2: The Impact of High Net Worth Households Across Political Contributions
As political contributions continue to break records over the past several cycles, Windfall wanted to understand who is driving the increased contributions or influencing fundraising activities. In our last post, we reviewed The National Landscape and Trends Across the Country, which provided us with a solid foundation on the overall evolution of political contributions. As 2022 contributions to both Republicans and Democrats increased over the 2018 midterms, Windfall wanted to look specifically at High Net Worth (“HNW”) donors.
Donations from HNW Individuals Vs. Total Donations

We are defining HNW as those that have at least $1 million of net worth (assets - liabilities). Currently, this population is estimated at anywhere between 13-18% of the US population. Thus, we aren’t just focusing on the top 1% but a relatively sizable population across the country.
Windfall has a unique vantage point given our focus on people intelligence and AI. Many of our customers leverage our intelligence to identify, understand, and engage segments of the population in various wealth, demographic, and psychographic profiles. In fact, we have published historical analyses around political contribution trends for HNW donors in the 2018 and 2020 election cycles.
HNW Total Contributions Across the Country
Due to some delays in reporting, Windfall wanted to analyze reporting through the end of August 2022 to understand the trends of this election year versus historical cycles. Interestingly, it appears that HNW donors are outpacing even their record contributions in 2020.
Percentage of Total Amount from HNW Individuals

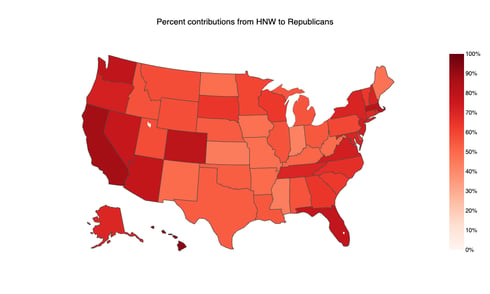
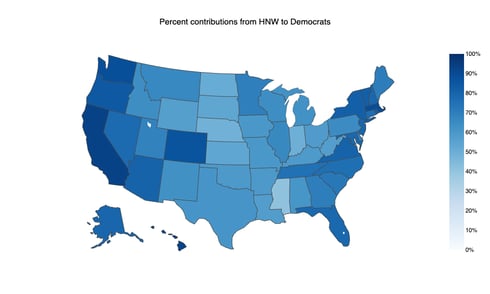
Holistically, if we look across the country we can see that HNW donors are dominant in most states contributing more than ~40%+ in each state across the union. This is pretty staggering when we think about the footprint of each individual in this population (estimated to be ~13-18% of the total households in the US). Another way to think about this is that their dollars are helping make a ~3x impact for any given voter.
Percent Contributions from HNW to All Parties

Percent Contributions from HNW to Republicans Vs. Percent Contributions from HNW to Democrats


Interestingly enough, the graphs look nearly identical to our overall heat map. This effectively showcases a density graph of where HNW individuals live. However, since we are capturing ALL HNW donors in this scenario, it is important to also look at how HNW individuals contribute to races outside of their home state.
HNW Donors Out-of-State Influence
As we described in our last post, candidates who raise more money generally win 75%+ of the time. HNW donors have the capacity or ability to give more – this doesn’t mean they all do, but they at least have the means to make an impact. Revising our heat maps, we only focused on HNW donations across state lines:
Gross Amount Totals from HNW Individuals: Amounts Received from Out of State
Gross Amount Totals by HNW Individuals: State for Republican Candidates Vs. Democratic Candidates. Amounts Received from Out of State.
Interestingly, the patterns are starting to diverge. Specifically, we can see that both parties are enjoying HNW donations across state lines in battleground states like Georgia or Pennsylvania; however, Democrats certainly funneled more dollars on a relative basis into Nevada while Republicans sent their money to Ohio and Wyoming. Even without dollars, we can see the number of HNW donors across state lines is much higher for Democrats versus Republicans:
Count of Out of State HNW Republican Vs. Democratic Donors
Out-of-state HNW Republicans seem to funnel money into “redder” states like Florida, Texas, and even Louisiana compared to HNW Democrats, who tend to support more races in purple states.
After reading through our analyses, you may wonder which specific elections drew the most contributions, and how HNW donors impacted specific races. In our next post, Windfall digs into these races to determine the influence of political contributions on the overall outcome of the election. In the meantime, subscribe to our blog for future data-driven insights of interest today!
If you’d like to learn more about how Windfall’s understanding of people data can take your organization to the next level, please reach out to the Windfall team.
Sources & Footnotes:
(1): FEC and Windfall 2022.
This article was written by Windfall’s Arup Banerjee, CEO and Co-founder, Christa Hammond, Director of Data Science, and David Schemitsch, Senior Data Scientist, using a combination of FEC and Windfall’s data.
About Windfall
Windfall is a people intelligence and AI company that gives go-to-market teams actionable insights. By democratizing access to people data, organizations can intelligently prioritize go-to-market resources to drive greater business outcomes. Powered by best-in-class machine learning and propensity modeling, Windfall activates insights into workflows that engage the right people for each respective organization. More than 800 data-driven organizations use Windfall to power their business.


